Command Line Quick Start
import numpy as np
import pandas as pd
import matplotlib.pyplot as plt
from opticalglass.glassfactory import create_glass, og_glass_libs
from opticalglass import glassmap
import opticalglass.util as og_util
Creating a Glass Object
You create a glass object using the create_glass() function.
The glass name and catalog name are the arguments.
bk7 = create_glass('N-BK7', 'Schott')
print(bk7)
Schott N-BK7: 517.642
bk7.glass_code()
'517.642'
Getting refractive index data
Use the rindex() method of the glass object to get the refractive index at the input wavelength. The wavelength input can either be a numeric value in nanometers or a spectral line character string.
nd = bk7.rindex('d')
nF = bk7.rindex('F')
nC = bk7.rindex('C')
nC, nd, nF
(np.float64(1.5143223472613747),
 np.float64(1.5168000345005885),
 np.float64(1.5223762897312285))
V-number and Partial Dispersion
Use the calc_glass_constants() function to calculate the optical constants given 3 refractive indices. The function accepts vector (NumPy) inputs as well, producing vector outputs.
vd, PCd = og_util.calc_glass_constants(nd, nF, nC)
nd, vd, PCd
(np.float64(1.5168000345005885),
 np.float64(64.1673362374998),
 np.float64(0.6923634296510195))
dFC = nF-nC
vd = (nd - 1.0)/dFC
PCd = (nd-nC)/dFC
nd, vd, PCd
(np.float64(1.5168000345005885),
 np.float64(64.1673362374998),
 np.float64(0.30763657034898056))
bk7.rindex(555.0)
np.float64(1.5182740250316704)
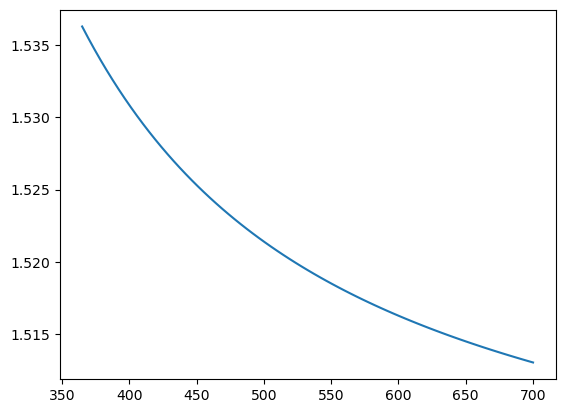
Plot Refractive Index vs Wavelength
You can get all of the refractive indices for a NumPy array of wavelengths using the calc_rindex() method of the glass object. This is (potentially) faster than using a loop over wavelengths and rindex().
wl = np.linspace(365., 700., num=75)
rn = bk7.calc_rindex(wl)
plt.plot(wl,rn)
[<matplotlib.lines.Line2D at 0x175d45c70>]

wl=[]
rn=[]
for i in np.linspace(365., 700., num=75):
     wl.append(i)
     rn.append(bk7.rindex(i))
plt.plot(wl,rn)
[<matplotlib.lines.Line2D at 0x177d7c050>]
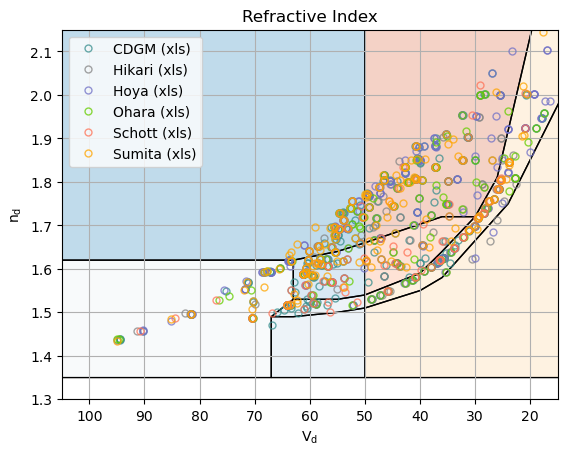
Display a Glass Map
The default display is index vs V-number. Other display options are available in the GlassMapFigure class.
The glass map is populated from a GlassLibrary instance. A subset of the library’s contents can be obtained by setting the active items in the library.
og_glass_libs.active_cltns = ['user', 'xls']
gmf = plt.figure(FigureClass=glassmap.GlassMapFigure,
                 glass_libs=og_glass_libs).plot()
Drag and Drop to the Command Line
The create_glass function accepts a glass that has been “dragged” from the glassmap python app. The string below is what gets dropped into the command line.
sbsl7 = create_glass("S-BSL 7,Ohara")
print(sbsl7)
Ohara S-BSL 7: 516.641
sbsl7.rindex('F')
np.float64(1.5219049400380837)
og_util.decode_glass_name(sbsl7.name())
DecodedGlassName(prefix='S', group='BSL', num='7', suffix='')
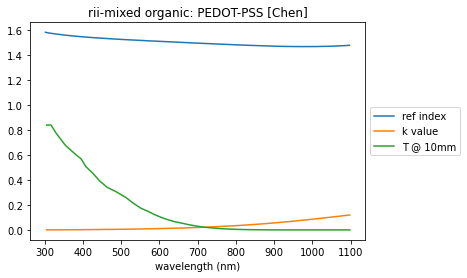
Glass Transmission Data
Get the raw transmission data from the catalog spreadsheet by using the transmission_data() method of the glass.
This returns the transmission data for a 10mm sample thickness.
A list of (wavelength (nm), transmittance) pairs is returned.
t_data = sbsl7.transmission_data()
Plot Transmission vs Wavelength
plt.plot(*t_data)
[<matplotlib.lines.Line2D at 0x308160e30>]