Command Line Quick Start
import numpy as np
import pandas as pd
import matplotlib.pyplot as plt
import opticalglass as og
import opticalglass.glassmap as gm
from opticalglass.glassfactory import create_glass
Creating a Glass Object
You create a glass object using the create_glass() function.
The glass name and catalog name are the arguments.
bk7 = create_glass('N-BK7', 'Schott')
print(bk7)
Schott N-BK7: 517.642
bk7.glass_code()
'517.642'
Getting refractive index data
Use the rindex() method of the glass object to get the refractive index at the input wavelength. The wavelength input can either be a numeric value in nanometers or a spectral line character string.
nd = bk7.rindex('d')
nF = bk7.rindex('F')
nC = bk7.rindex('C')
nC, nd, nF
(1.5143223472613747, 1.5168000345005885, 1.5223762897312285)
Defining a user-defined Glass object
It is also possible to work with a user-defined Glass object. There are several types of Glass objects available.
One particularly useful class is InterpolatedMedium, which creates a glass object by interpolating between a finite number of (wavelength, refractive index) data points.
For example, ‘BD-2’ is an infrared glass material whose refractive index is tabulated by the manufacturer. To create a Glass object,
from opticalglass import opticalmedium as om

# A list of ([wavelength in nm], [refractive index]) pairs
pairs = [
  (3000, 2.6266), (4000, 2.6210), (5000, 2.6173), (6000, 2.6142), (7000, 2.6117),
  (8000, 2.6088), (9000, 2.6055), (10000, 2.6023), (11000, 2.5983), (12000, 2.5942),
  (13000, 2.5892), (14000, 2.5843)
]
# user-defined glass object
glass = om.InterpolatedMedium('BD2', pairs=pairs, cat='LIGHTPATH')

# Then, this can be used as the same way to the predefined glass object
glass.rindex(2500)
array(2.6306544)
We can also register this user-defined glass by register_glass()
from opticalglass.glassfactory import register_glass
register_glass(glass)
Now, we can access to the glass from the name (BD2) and catalog (LIGHTPATH)
create_glass('BD2', 'LIGHTPATH')
InterpolatedMedium('BD2', cat='LIGHTPATH', wvls=[3000, 4000, ..., 14000], rndx=[2.6266, 2.621, ..., 2.5843], kvals_wvls=None, kvals=None)
V-number and Partial Dispersion
Use the calc_glass_constants() function to calculate the optical constants given 3 refractive indices. The function accepts vector (NumPy) inputs as well, producing vector outputs.
vd, PCd = og.util.calc_glass_constants(nd, nF, nC)
nd, vd, PCd
(1.5168000345005885, 64.1673362374998, 0.6923634296510195)
dFC = nF-nC
vd = (nd - 1.0)/dFC
PCd = (nd-nC)/dFC
nd, vd, PCd
(1.5168000345005885, 64.1673362374998, 0.30763657034898056)
bk7.rindex(555.0)
1.5182740250316704
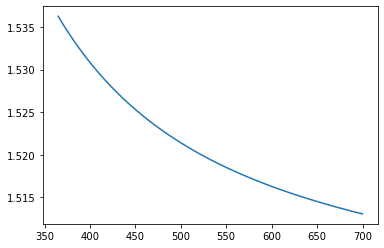
Plot Refractive Index vs Wavelength
You can get all of the refractive indices for a NumPy array of wavelengths using the calc_rindex() method of the glass object. This is (potentially) faster than using a loop over wavelengths and rindex().
wl = np.linspace(365., 700., num=75)
rn = bk7.calc_rindex(wl)
plt.plot(wl,rn)
[<matplotlib.lines.Line2D at 0x7fbf18ad80d0>]

wl=[]
rn=[]
for i in np.linspace(365., 700., num=75):
     wl.append(i)
     rn.append(bk7.rindex(i))
plt.plot(wl,rn)
[<matplotlib.lines.Line2D at 0x7fbf2860bd60>]
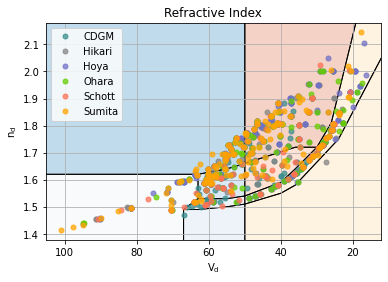
Display a Glass Map
The default display is index vs V-number. Other display options are available in the GlassMapFigure class.
The data plotted is controlled by GlassMapDB,the glass_db list. The default list includes all of the supported commercial catalogs. Additional lists of glasses can be added to the display.
gmf = plt.figure(FigureClass=gm.GlassMapFigure,
                 glass_db=gm.GlassMapDB()).plot()
Drag and Drop to the Command Line
The create_glass function accepts a glass that has been “dragged” from the glassmap python app. The string below is what gets dropped into the command line.
sbsl7 = create_glass("S-BSL 7,Ohara")
print(sbsl7)
Ohara S-BSL 7: 516.641
sbsl7.rindex('F')
1.5219049400380837
og.glass.decode_glass_name(sbsl7.name())
(('BSL', '7'), 'S', '')
Glass Transmission Data
Get the raw transmission data from the catalog spreadsheet by using the transmission_data() method of the glass.
This returns the transmission data for a 10mm sample thickness.
A list of (wavelength (nm), transmittance) pairs is returned.
t_data = sbsl7.transmission_data()
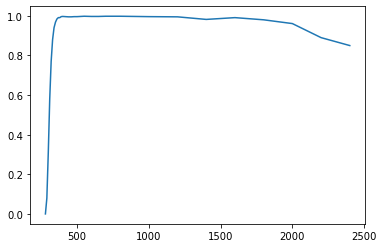
Plot Transmission vs Wavelength
plt.plot(*t_data)
[<matplotlib.lines.Line2D at 0x7fbf18d08040>]